Web App
Vending Machine Telemetry
Muddbites Telemetry
A telemetry web app I built for Muddbites, a student-run vending team at Northwestern: receipt OCR for warehouse intake, slot-by-slot restocking, sales import, per-product analytics with rule-based insights, and a pricing model grounded in the price-elasticity literature.
Motivation
A request from the Muddbites team
Muddbites is a student-run vending project at Northwestern that sells Asian snacks on campus. Snacks move from grocery stores into a student-run warehouse, from the warehouse into a vending cabinet, and from the cabinet out to customers. Along that chain, stock disappears. Boxes miscount, items expire, a few walk off. The team wanted to see where.
The proposal the team handed over set three concrete constraints. Grocery pickup is high-stress; the only reliable record of what’s in the cart is a receipt photo or a printed spreadsheet. Manual per-snack counting at pickup is a non-starter. Once snacks are in the warehouse, inventory is kept loosely by counting leftover boxes. Pricing is arbitrary, and the team wants data-backed price experimentation.
The whole system is organized around one accounting identity:
What it does
Seven surfaces over one data model
The operator works through seven pages, each mapped to a moment in the snack lifecycle: setup, daily status, restocking, receipt-based warehouse intake, sales import from the vending terminal, analytics with rule-based recommendations, and price-elasticity modelling.

01 · Onboarding
First-run setup wizard
On first login, an OnboardingGate detects an empty catalog and redirects to a three-step wizard: welcome, products, slots. Operators add products with sale price, cost, units per box, and category, then map each one to a slot. Other pages stay gated until at least one product exists so the rest of the app always reads against real data.
02 · Dashboard
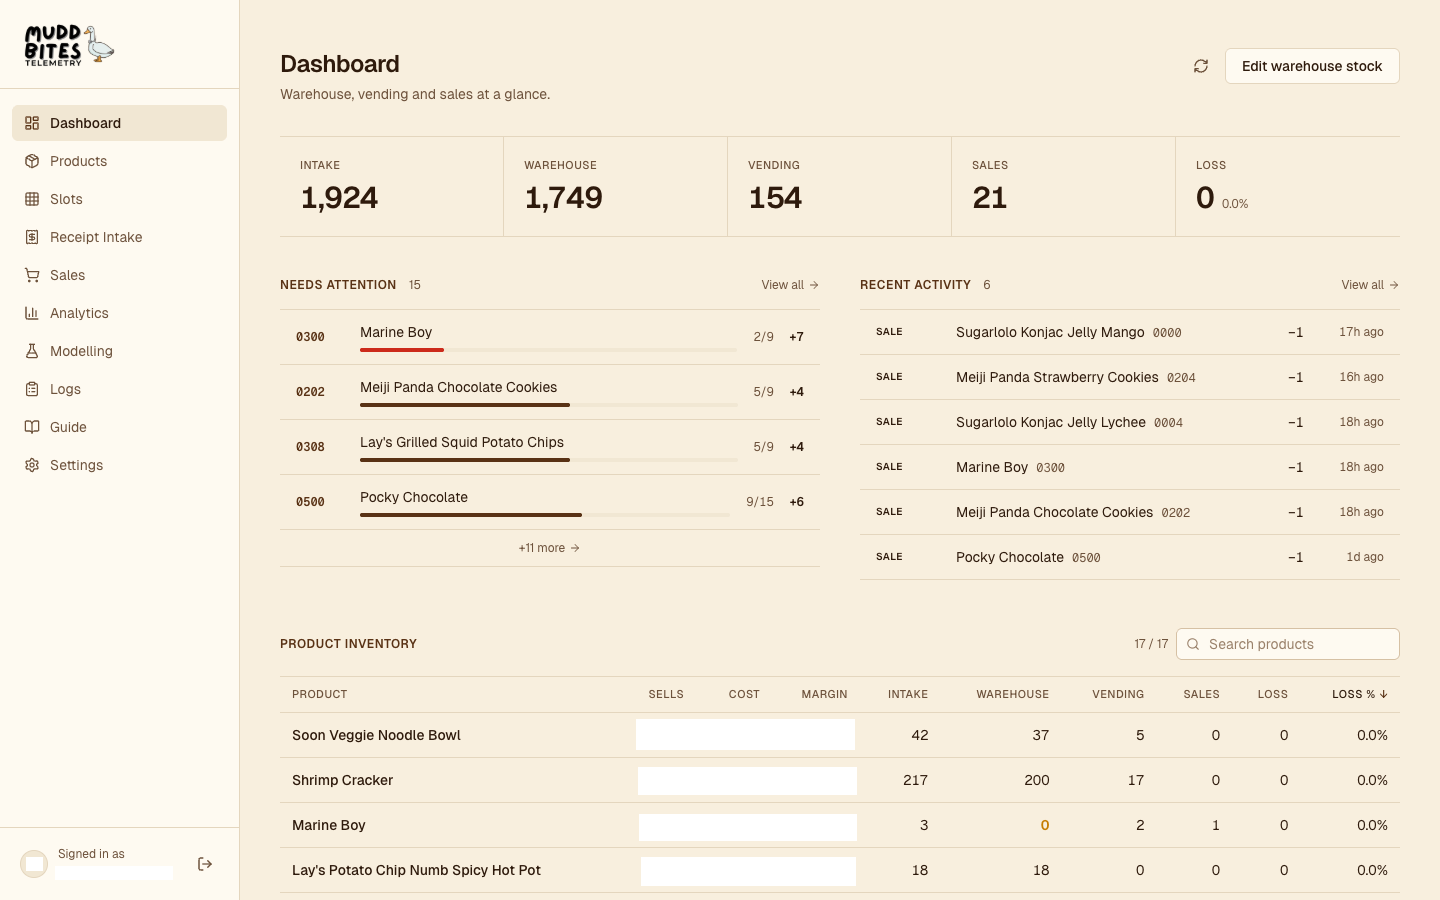
Daily operational read
A five-number metric strip: how much stock has come in, how much sits in the warehouse, how much is in the machine, how much has sold, and how much is unaccounted for. Restock alerts and a recent activity feed sit beneath, and a sortable product table shows inventory status by line item.
03 · Slots
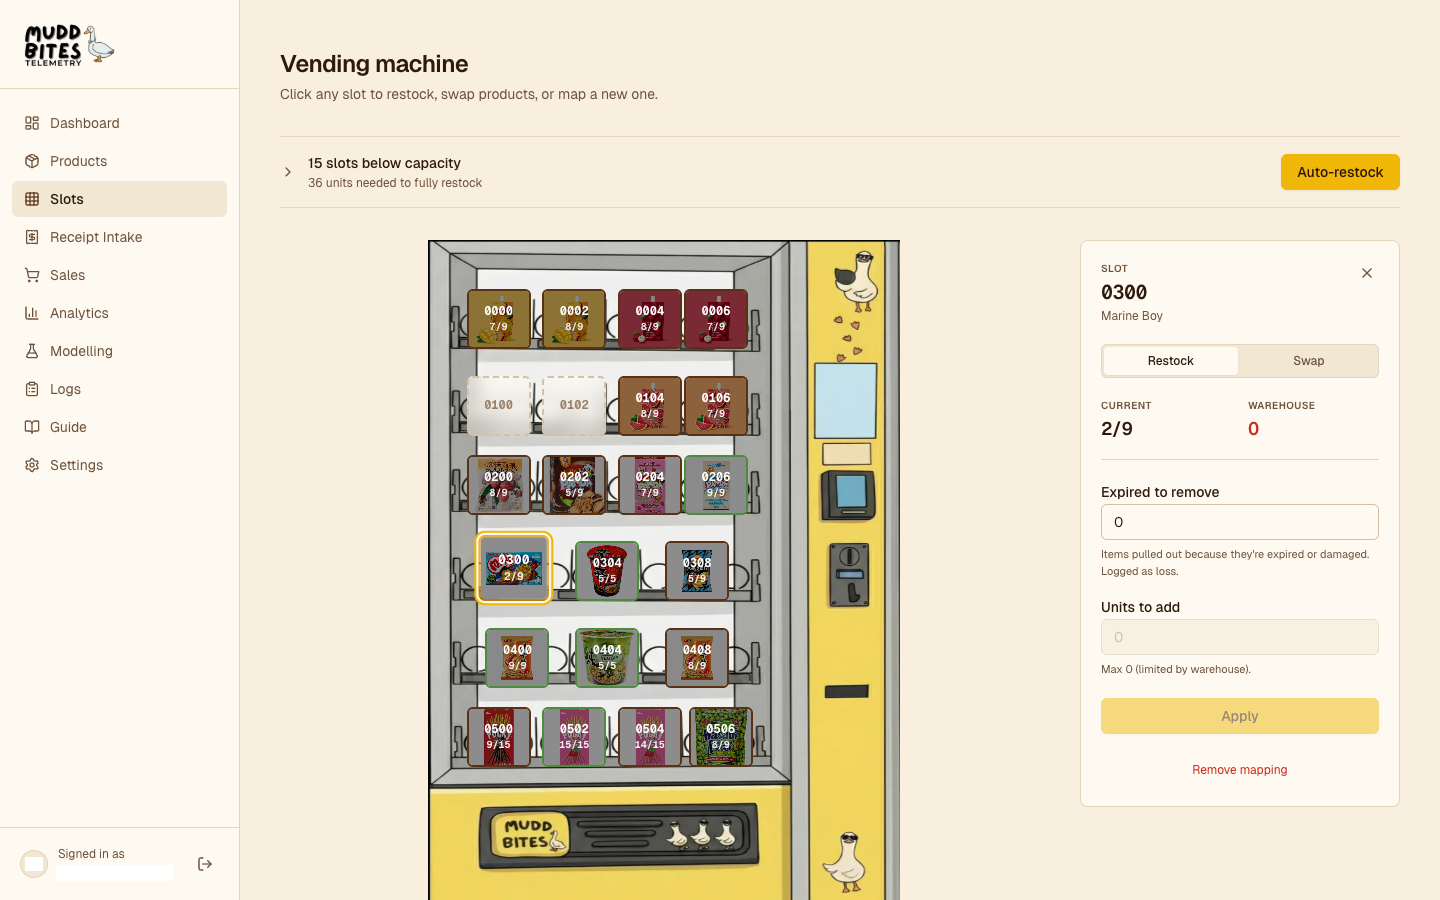
Pill overlay on a photo of the machine
The slots page positions a pill for each of the 22 slots over a photo of the actual machine, each one coloured by fill ratio and showing currentStock / capacity. Clicking a pill opens panels for restock (deduct from warehouse, add to slot, log the event), product swap (reassign the slot and append to the slot_assignments timeline), and expired removal. A picklist beneath lists every slot below capacity sorted by urgency, with an auto-restock button that pre-plans a deduct-and-fill for every slot the warehouse can cover.
04 · Intake
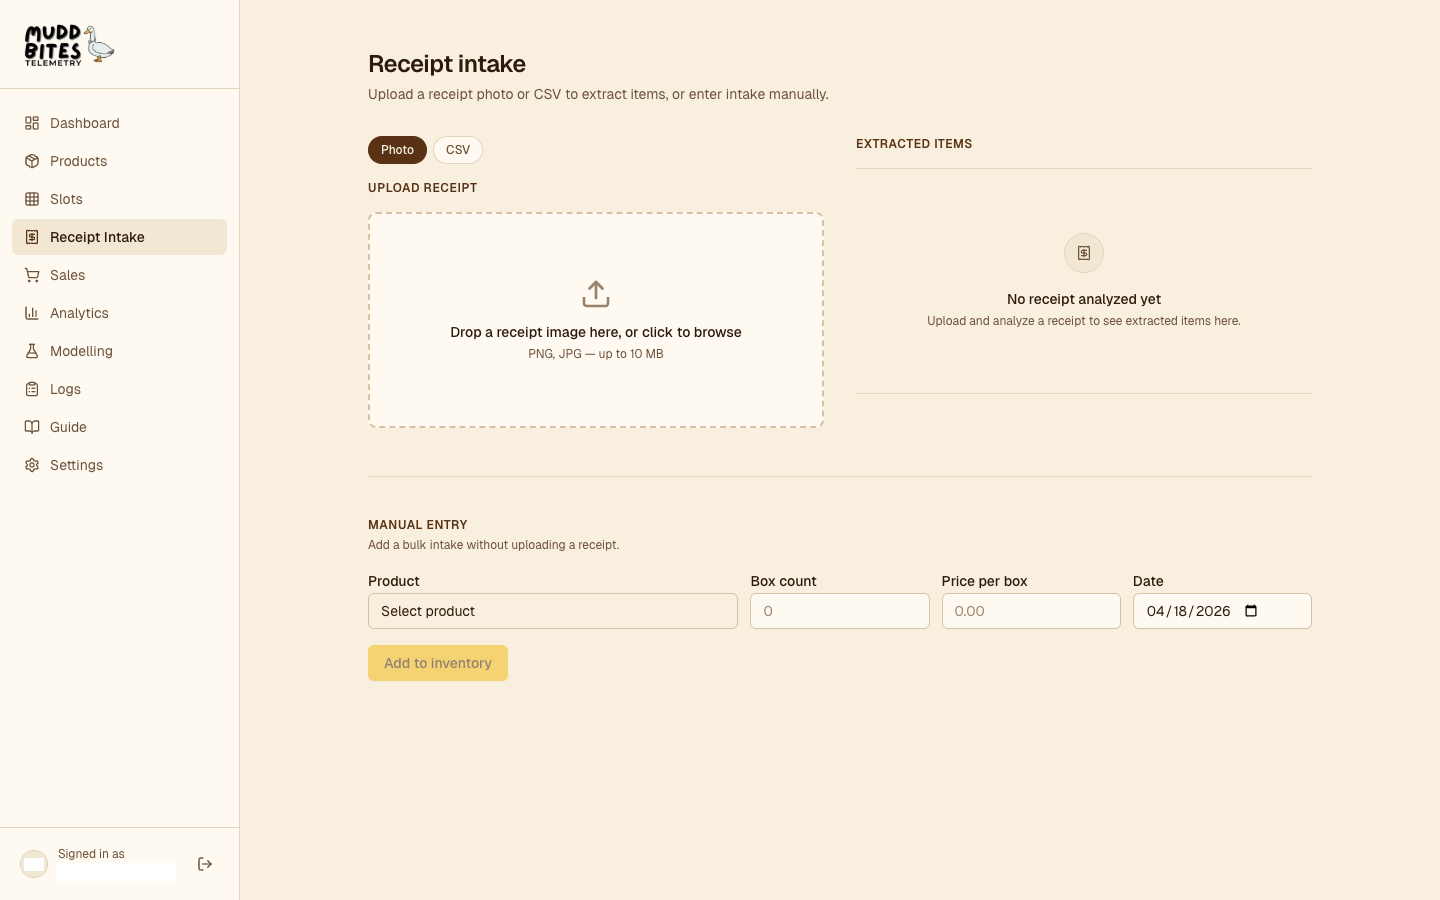
Receipt photo to parsed line items
The operator photographs the grocery receipt and uploads it. The route returns structured line items with quantity, per-unit price, and a box-or-unit tag derived from price (above BOX_PRICE_THRESHOLD, default $4, it’s a box). The operator reviews the result, matches each row to a catalog product, and commits, which writes warehouse stock and a dated intake log in one transaction.
05 · Sales import
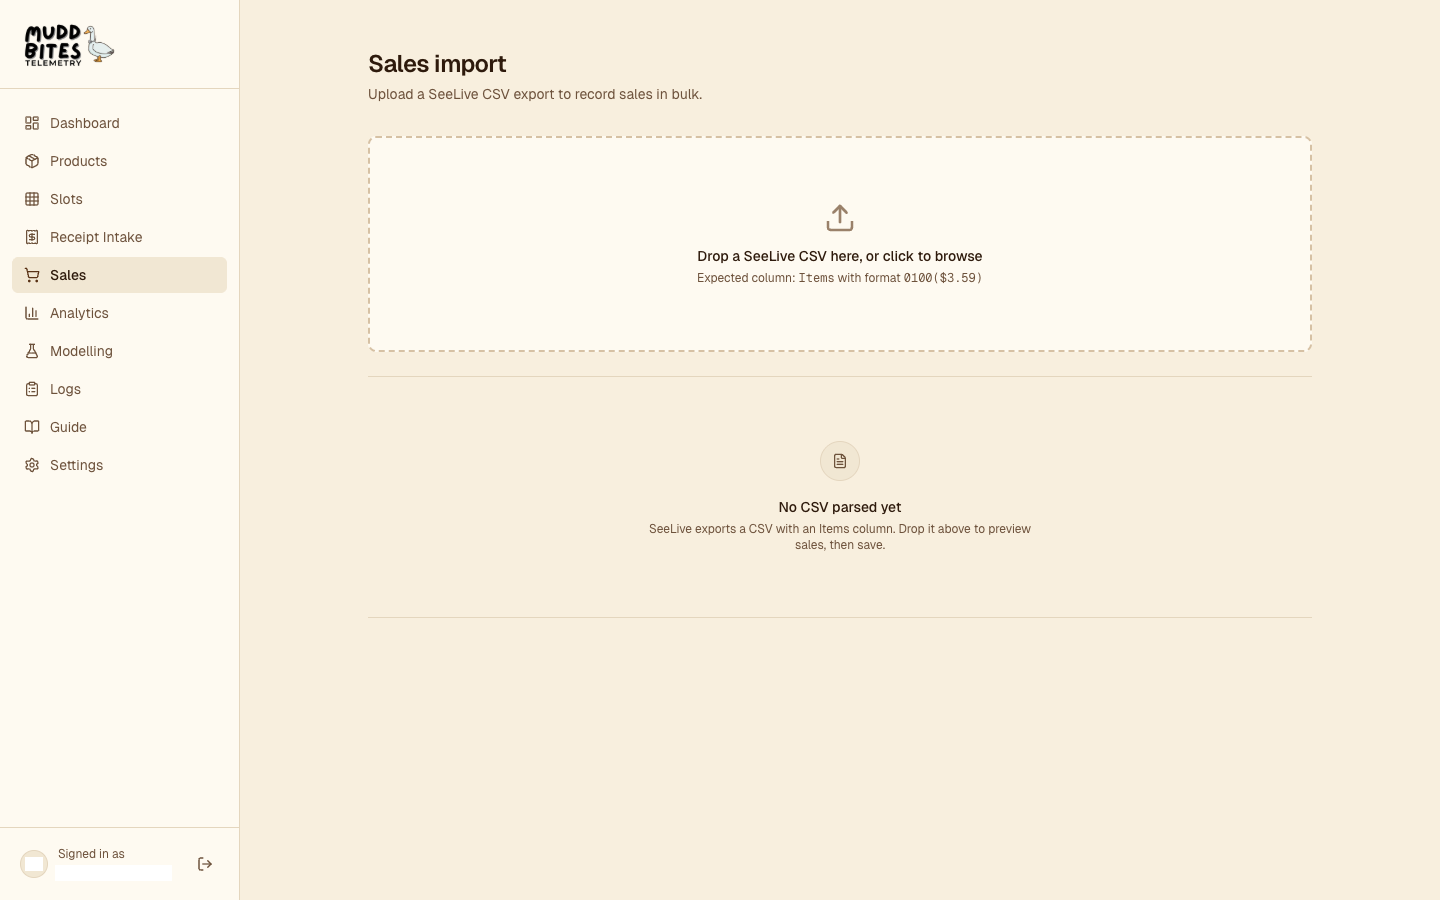
SeeLive CSV → sale events
The vending terminal exports a SeeLive CSV with an Items column formatted like 0100($3.59). The page parses each row, matches the slot ID to its current product, and records a sale log. Timestamps arrive without a timezone, so they’re parsed explicitly as Eastern time before they become each log’s eventDate.
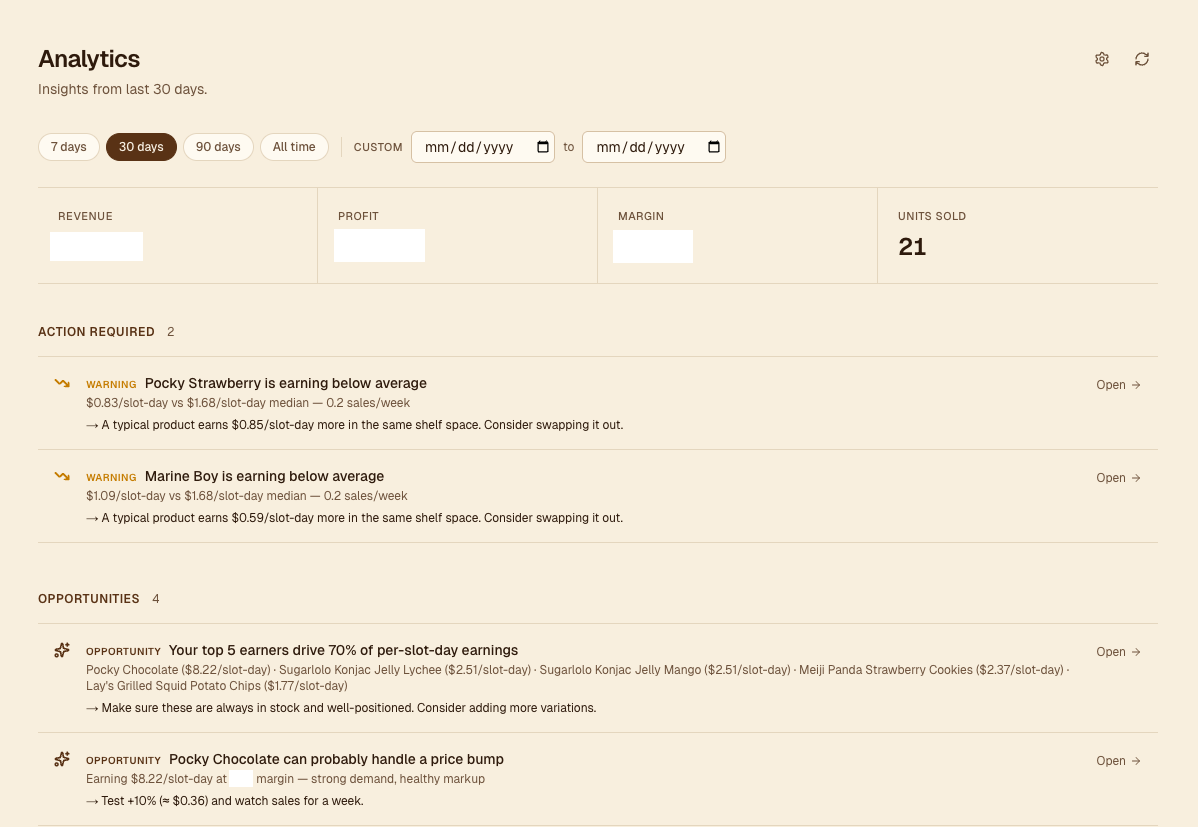
06 · Analytics
Two-phase insights engine
The analytics page runs a set of typed rules against per-product stats and surfaces them as Action Required and Opportunities. Rules run in two phases: price-sensitive rules run first and register affected products in a blocked set; structural rules run second, and the slot-allocation rule excludes blocked products so pending price moves don’t contaminate swap math.
Phase 1 · Price rules
| Rule | Fires when | Suggested action |
|---|---|---|
| Negative margin | current margin < 0 | Raise price by the per-unit loss, or discontinue |
| Margin warning | margin < targetMargin − 5 pp | Raise price or find a cheaper supplier |
| Raise-price candidate | top-quartile $ / slot-day AND margin ≥ targetMargin + 15, window ≥ 14d | Try a +10% price test (14-day cooldown on this rule) |
Phase 2 · Structural rules
| Rule | Fires when | Suggested action |
|---|---|---|
| Drop candidate | days since last sale ≥ 30 AND currently slotted, window ≥ 14d | Replace the slot with a faster mover, or lower the price to test demand |
| Underperformer | bottom-quartile $ / slot-day, ≥ 4 peer products | Swap out of its slot |
| Top performer | top 5 by $ / slot-day, falling back to window profit then revenue when velocity or cost data is missing | Keep stocked, consider variations |
| Slot allocation | a (Y → Z) swap gains > $0.10/day after a 0.7 diminishing-returns factor | Reallocate a slot from Y to Z; top 3 swaps shown |
Rules stay silent until windowDays ≥ minInsightWindowDays and the peer count is sufficient for quartile comparisons.
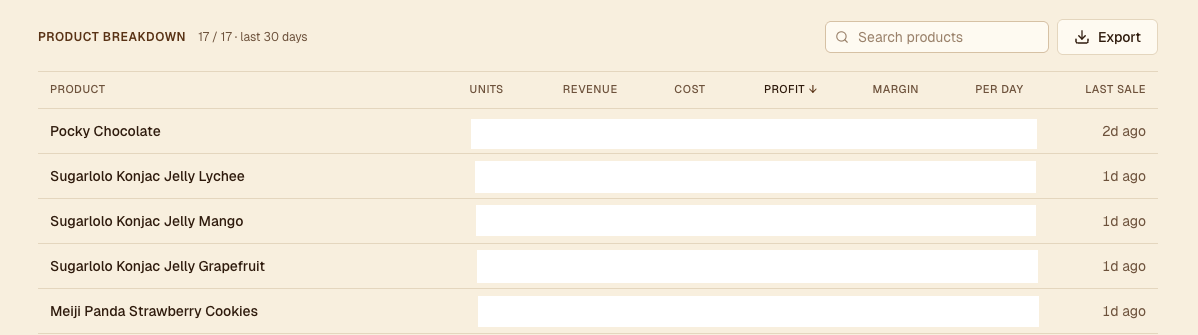
Per-product stats
Units sold, revenue, cost (weighted-average across priced intakes), profit, margin, per-day velocity, and days since the last sale, over the selected window. Sortable by any column, searchable, and exportable to CSV.
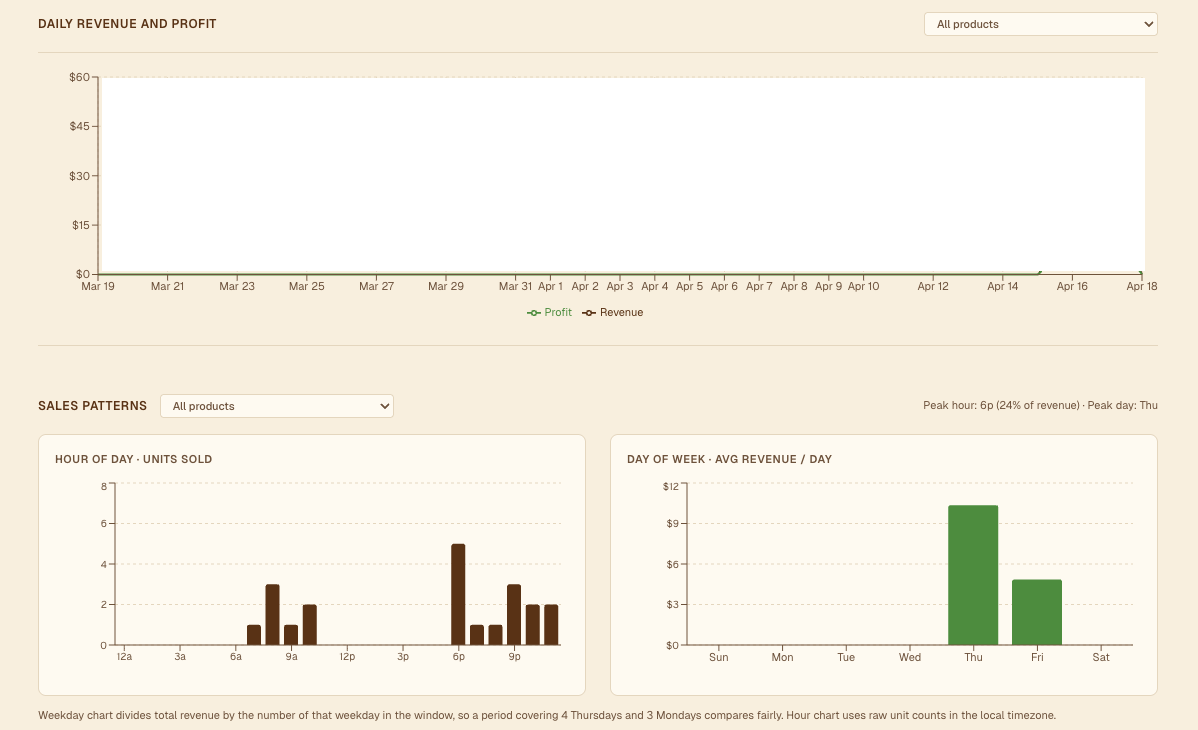
Time-pattern charts
Daily revenue and profit over the window, and distributions of sales across hour-of-day and weekday. The weekday chart divides each bucket by the number of that weekday present in the window so periods with uneven calendar coverage compare fairly; that counter advances with setDate(+1) rather than adding 24 hours, so DST transitions don’t drift the cursor off local midnight.
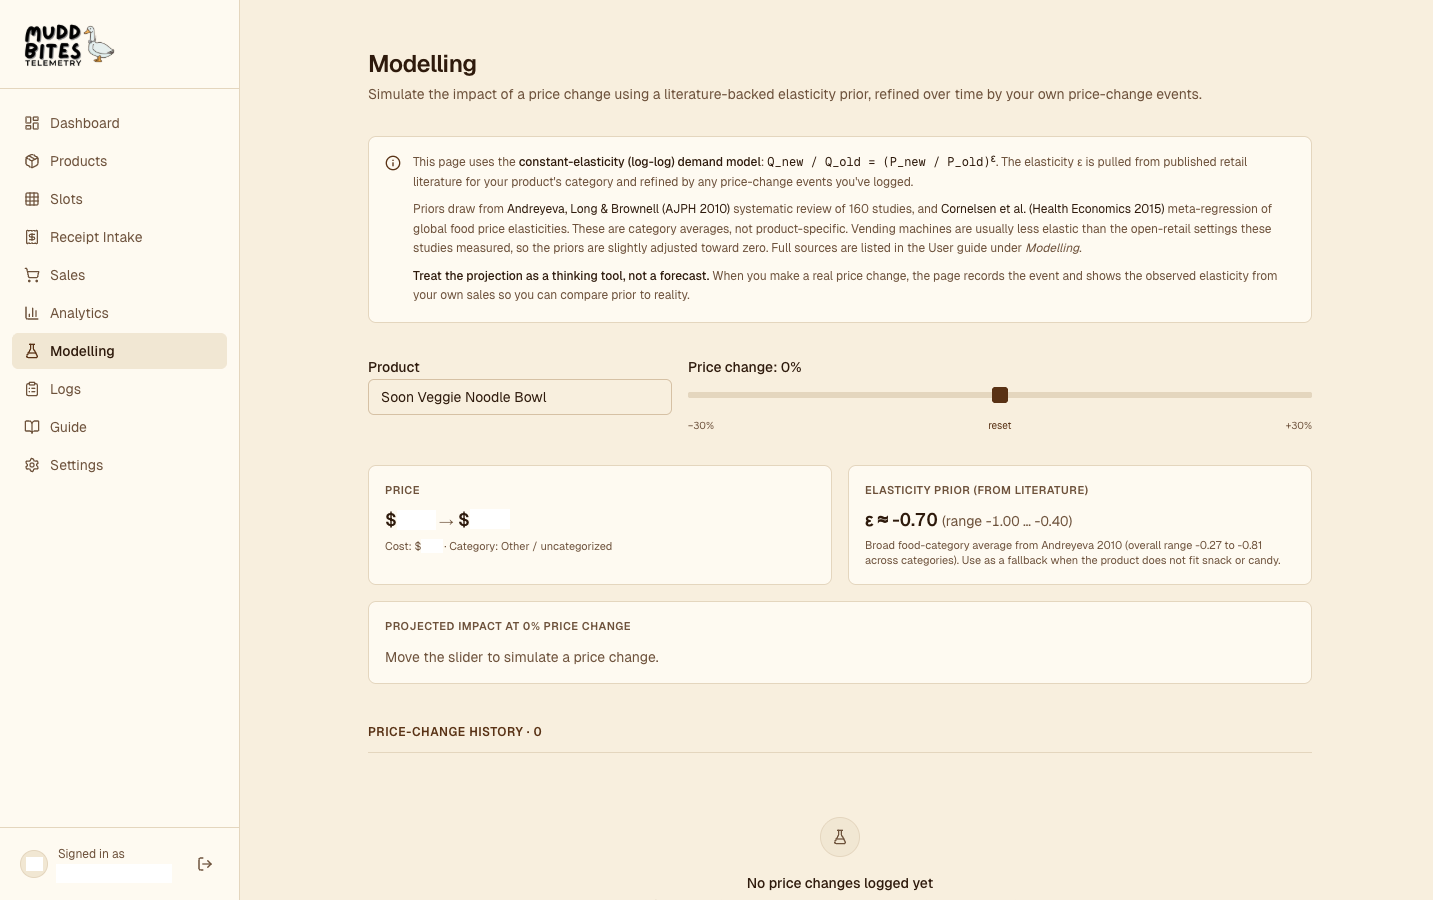
07 · Modelling
Price-elasticity projections
A single machine’s price history is too thin to estimate elasticity cleanly. The page starts from a category prior drawn from the food-pricing literature and lists each row from price_changes as an observed arc estimate alongside the prior.
Constant-elasticity demand model
At ε = −1, a 10% price increase projects a 10% quantity drop. The UI plots the projection across the full plausible range of ε for the product’s category.
Arc elasticity from one observation
Each row in price_changes yields one observation: a 14-day pre-change window paired with a 14-day post-change window.
Category priors
| Category | Midpoint ε | Plausible range | Source |
|---|---|---|---|
| Snacks | −0.8 | −1.1 to −0.5 | Andreyeva 2010 (food away from home ≈ −0.81) |
| Candy / confectionery | −0.4 | −0.6 to −0.2 | Andreyeva 2010 (sweets/sugar ≈ −0.34) |
| Other | −0.7 | −1.0 to −0.4 | Broad food-category average |
Values are pulled closer to zero than the raw meta-analytic means to account for the captive vending setting, where substitution options are fewer than in open retail.
Data model
Three core collections, two supporting timelines
All operational state derives from products, slot_mappings, and the append-only inventory_logs stream. Two supporting timeline collections, price_changes and slot_assignments, record history that analytics consumes.

Solid boxes hold current state; dashed boxes are append-only timelines.

The loss invariant is an accounting identity over this lifecycle.
products
Master catalog. Stores warehouseStock and the denormalized counters that keep dashboard reads O(products).
| name, price | display + sale price |
| warehouseStock | uncased inventory |
| costBasisUnits | denominator for WAC |
| costBasisTotal | numerator for WAC |
| totalIntake / totalSales | rolling counters |
| lastSaleAt | monotonic timestamp |
slot_mappings
Current assignment of a product to each machine slot, with current stock and physical capacity.
| slotId | e.g. '0100' |
| productId | FK to products |
| productName | denormalized |
| currentStock | units in the slot |
| capacity | physical max |
inventory_logs
Append-only event stream. Every stock change writes a typed row, making history reconstructable and auditable.
| type | intake | sale | restock | adjustment | expired |
| amount | signed units |
| purchasePrice / salePrice | at event time |
| eventDate | when it happened |
| createdAt | when it was logged |
price_changes
Timeline of price edits. Consumed by arc-elasticity estimation and by the 14-day cooldown on the raise-price insight rule.
| productId | FK to products |
| oldPrice / newPrice | before + after |
| eventDate | when the change applied |
slot_assignments
Timeline of which product occupied which slot. Enables effective slot-day computation for products that moved between slots.
| slotId / productId | mapping (empty productId = cleared) |
| eventDate | start of this assignment |
| reason | testing | discontinued | stockout_response | seasonal | performance | other |
Technical notes
Six engineering decisions worth calling out
The notes below focus on tradeoffs that shaped the system, each referencing the file where it lives.
01
Denormalized counters
Scanning the log stream on every dashboard load is not viable on Firestore’s per-read pricing. Rolling counters on the product document (totalIntake, totalSales, costBasisUnits, costBasisTotal, lastSaleAt) update via increment() inside the same transaction as the log write, so dashboard reads stay O(products).
02
Atomic mutations
Every stock mutation reads current state, validates invariants (enough warehouse stock, slot capacity, amounts under MAX_UNITS = 1,000,000), updates the affected documents, and writes the log inside one runTransaction. All writes commit together or none do, keeping the loss invariant balanced.
03
Receipt OCR parse-and-stitch
Document AI’s Expense Parser returns one entity per line-item field and sometimes splits a single row across multiple entities. The stitcher flushes on each new description and merges orphan number-only entities into the active item, deriving missing per-item price from line-total ÷ quantity.
04
Weighted-average cost
Intakes arrive at varying prices. FIFO would mean tracking which batch each sold unit came from. WAC stores two rolling counters per product and recomputes average unit cost in constant time. When a product has no priced intakes, profit returns null and the UI renders “unknown”.
05
Effective slot-days
A product occupying two slots for 30 days and a product occupying one slot for 60 days both consumed 60 slot-days of shelf space. The analytics layer walks the slot_assignments timeline and intersects each interval with the analysis window, producing effectiveSlotDays as the comparable denominator for velocity and contribution margin.
06
Monotonic lastSaleAt + idempotent backfill
Real-time sales and historical CSV imports both update lastSaleAt, but only forward. A 2023 CSV row cannot overwrite a 2025 real-time sale. backfillProductCounters rebuilds denormalized counters from the log stream when missing and is a no-op afterwards, so it can run on every cold start.
Tech stack
| Layer | Technology | Role |
|---|---|---|
| Framework | Next.js 16 (App Router) | Full-stack framework, React 19 |
| Styling | Tailwind CSS 4 | Utility-first CSS |
| Lucide, Sonner | Icons + toast notifications | |
| Data | Firestore | Documents + transactions |
| Firebase Admin SDK | Server-side writes + custom tokens | |
| SWR | Client cache + revalidation | |
| Ingestion | Google Document AI | Receipt OCR (Expense Parser) |
| Sharp | Server-side image optimization | |
| PapaParse | SeeLive sales CSV | |
| Analytics | Recharts | Hourly + weekday distribution charts |
| Zod | Document AI response validation |